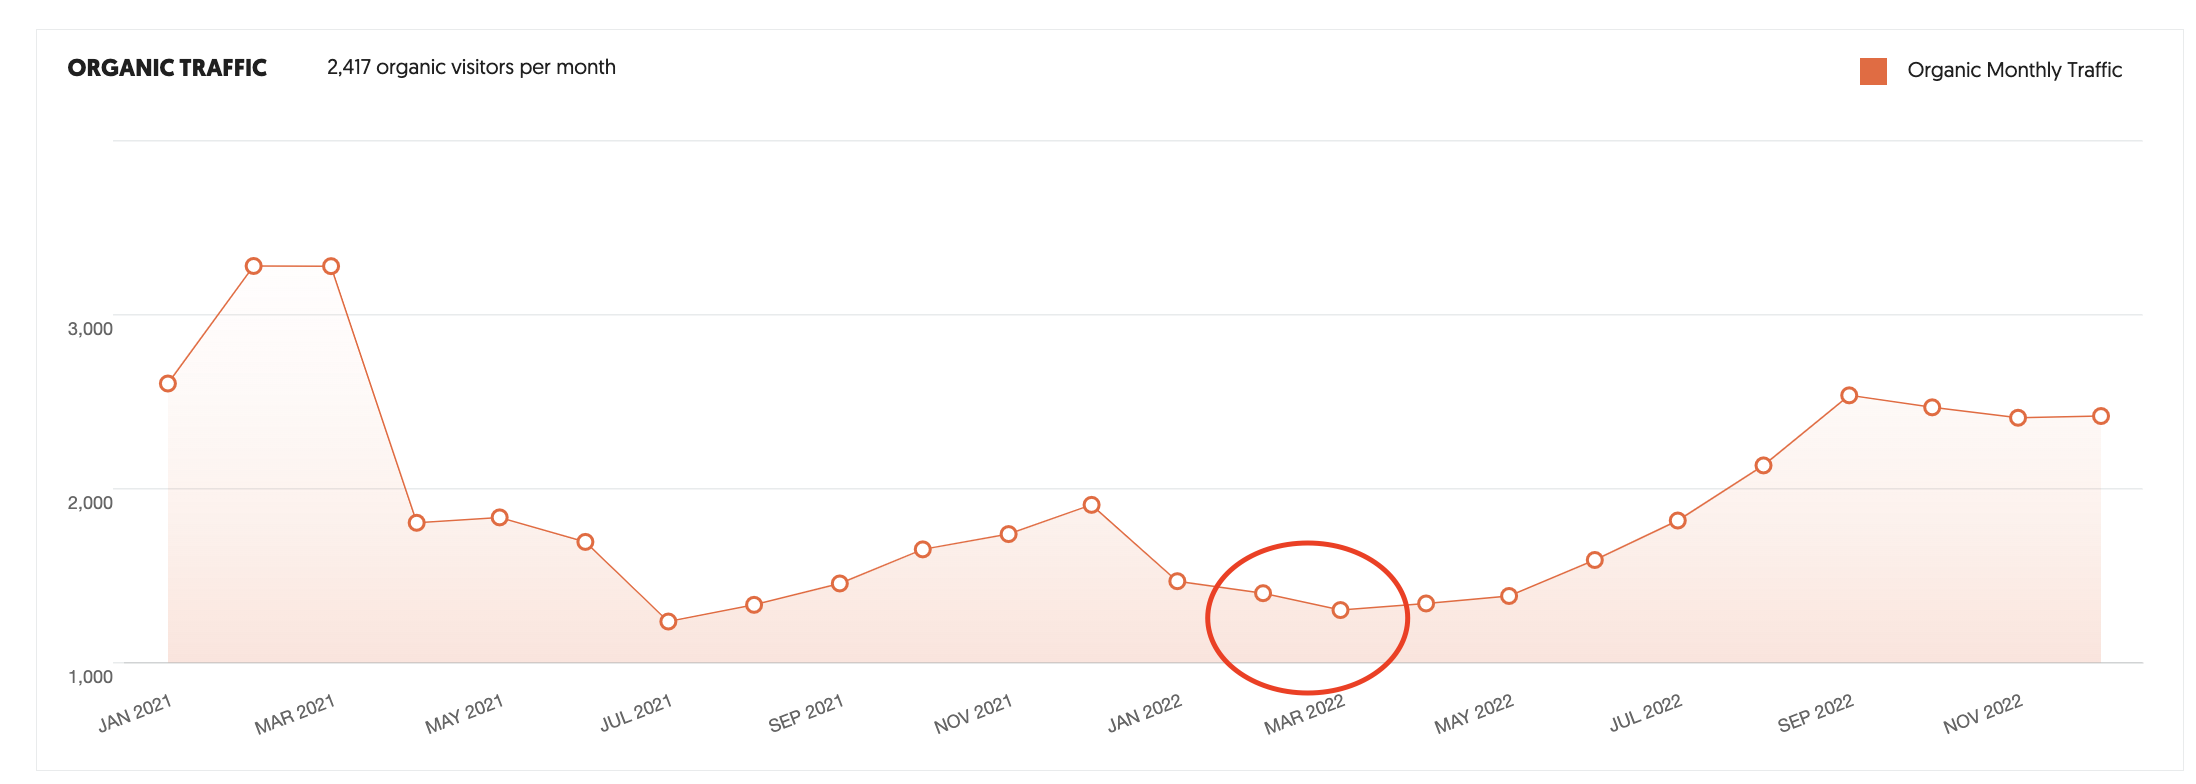
A clean, minimal line chart visualizing organic monthly website traffic over approximately 20 months from April 2021 to December 2022. The data shows a general upward trend from roughly 253 visitors in April 2021, a peak near 365 in February–March 2022, a mid-year 2022 dip to around 290, and a recovery ending at 369 visitors per month. The chart uses an orange/salmon color scheme with circular data-point markers and a soft gradient fill beneath the line on a white background.
Studio
All photos

Aug 24, 2023

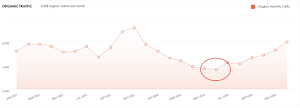
Organic Monthly Traffic Line Chart – April 2021 to December 2022

Organic Monthly Traffic Line Chart – April 2021 to December 2022

Organic Monthly Traffic Line Chart – April 2021 to December 2022